Recent Posts


Products
-
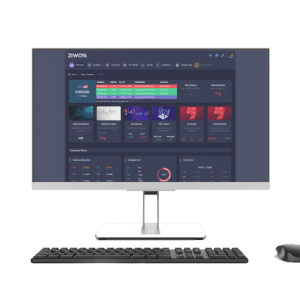
 Ziwox Terminal
Price range: $19.00 through $216.00
Ziwox Terminal
Price range: $19.00 through $216.00 -
 Telegram Signal pro
$110.00
Telegram Signal pro
$110.00 -
Order Squeeze
$220.00
-
Flow Trend
Original price was: $69.00.$0.00Current price is: $0.00.
-
Gold Extractor
Original price was: $290.00.$210.00Current price is: $210.00.