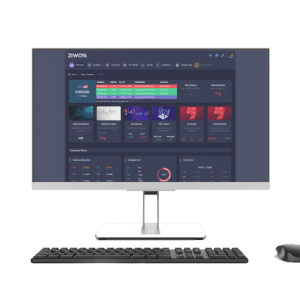
WEEKLY GOLD HINT and analysis

Weekly gold analysis

◽️ FED raised the interest rate 75bp on Wednesday, the highest level in 28 years, But the gold market has shown good resistance to this sharp hike in interest rates

◽️ Rising fears of a recession have led to a sharp drop in the stock market, cryptocurrency, and ounce support in the 1800s.

◽️ Investors who are selling their stock, and their Cryptocurrency assets, will definitely invest some of their capital in gold.

◽️ But remember this point, Big Investors and Business owners have to sell their gold and cryptos to provide the margins they need and protect their companies.

🔻 So, because of recession risk, we may have a short-term downside on gold, But in long term, what we predicted, gold is in good support

🔻 As long as the price of gold remains between 1878 and 1787, it is technically considered a neutral move.

🔻 Gold will reach $2,000 when the Federal Reserve no longer puts pressure on the economy, and the government increases spending again.

WEEKLY GOLD HINT and analysis

Weekly gold analysis

◽️ Last week wee see an intense flight for gold, main reason was escape from the inflationary recession.

◽️ Despite the Federal Reserve’s hawkish policies, inflation remains high, and this is a major sign of recession, So gold got a great support.

◽️ Investors have deep doubts about the Fed’s ability to contain inflation.

◽️ The rise in gold prices came after the US Department of Labor announced that the consumer price index in May had risen 8.6 percent from a year earlier.

◽️ The Federal Reserve’s decision on this week could put more short-term pressure on gold.

◽️ The Federal Reserve is likely to raise interest rates by 50 basis points on Wednesday, June 15

🔻 So our forecast is short-term bearish because the fed monetary policy

🔻 But it has a long way to go because we predict the Federal Reserve cannot reduce inflationary pressures

🔻 The market calms down a bit this week after digestion, but as we mentioned earlier, gold stays bullish for a long time.

WEEKLY GOLD HINT and analysis

Weekly gold analysis

◽️ Gold try to recover it’s losses last week but seems to be having a tough gathering bullish momentum.

◽️ The US10Y grew around 1% last days of the week and pressured on gold.

◽️ The Federal Reserve Hawkish policies are the only thing that puts downward pressure on gold

◽️ But in our view, gold maintains its upward bias But the economy is not so strong and most experts are talking about a recession

◽️ We predict a period of stagflation and this is positive for gold.

◽️ What matters in the short term is the Federal Reserve raising interest rates, which is driving traders to buy dollars.

◽️ The Fed will remain seriously Hawkeyes, and we will see more than a 50-fold increase in interest rates.

◽️ The Fed will remain seriously Hawkeyes, and we will see more than a 50-fold increase in interest rates.

🔻 As a result, we are waiting for the gold trade to be ready for a recession and a rise in gold after the end of US monetary policy.

WEEKLY GOLD HINT and analysis

Weekly gold analysis

◽️ As the old saying goes, markets can stay overbought and oversold longer than most of us can stay solvent,” said Darin Newsom, president of Darin Newsom analytics.

◽️ “Additionally, Newsom’s Rule #6 tells us ‘fundamentals win in the end,’ and the U.S. dollar’s fundamentals remain bullish.

◽️ Investors worried that a more aggressive move by major central banks to constrain inflation could hit global economic growth and lead to a recession

◽️ Risk aversion and Protecting assets against inflation flow spurred a rally in bonds, due the 10-year yields peak of 3.20% could lend some support to the safe-haven gold

◽️ hedge against inflation could help limit deeper losses for the XAUUSD, at least for now

◽️ What matters most is the results of US inflation news this week, Retail Sales, Building Permits, Crude Oil Inventories, Philadelphia Fed Manufacturing Index

◽️ Calendar event result can shows the outlook of FED monetary policy for next sessions And it can be a potential driver for gold movement

🔻 The possibility that the Fed’s tightening cycle will lead to a recession is good news for gold.

WEEKLY GOLD HINT and analysis

Weekly gold analysis

◽️ Last week, the price of gold struggled to keep its price against the US dollar index due the US dollar index reaches to 104 level, the highest in nearly 20 years

◽️ FED is ready to raise interest rates by 50 basis points this week, and this has led to an increase in the strength of the US dollar and keep gold in low

◽️ On the other hand, the US dollar index reached 104, the highest level in last 20 years, AND any retracement on DXY can move gold to the upside.

◽️ However, the Federal Reserve has indicated that it is preparing to another hawkish monetary policy, But dollar seems to have priced all the hawkish monetary policy and is now at its highest level and only needs a flip.

◽️ Given that the price of gold was able to maintain its support despite the strength of the dollar, now we feeling better to looking for long positions

🔻 Gold’s downtrend move seems is running out but all ayes on Fed interest rate decision and see what happens for market with that decision

🔻 Any neutral tone or dovish by the central bank could devalue the US dollar and increase the price of gold.

WEEKLY GOLD HINT and analysis

Weekly gold hint

Weekly gold analysis

◽️ Downward pressure, Due to the Hawkeye FED monetary policy alongside the Upward pressure because of the inflation risk and war, we have a MIX Sentiment in gold

◽️ There are a lot of Long and Short trades on gold and according to the COT report analysis, we had -14,530 positions trimmed in total 239,757 net positions

◽️ Although the Ukrainian war is priced in the market, a stalemate in Ukraine’s peace talks could put upward pressure on gold

◽️ Further downward pressure on gold indicates that the market is focusing on Fed monetary policies.

◽️ Everyone is waiting for the results of global economic data to clear up and estimate the economy grows and inflation

◽️As the U.S. dollar and bond yields continue to rise we can see lower prices in gold around $1900

🔻 All ayes on GDP, Crude oil investment, and Core Durable Goods Orders calendar events this week

🔻 Technically if gold can hold the 1916$ area we prefer to enter a new long position

Ziwox.com

WEEKLY GOLD HINT and analysis

Weekly gold hint

Weekly gold analysis

◽️During the last trading week, gold touched a high of $1,985 on Wednesday. And even though prices saw a drop Thursday, gold futures are ending the week up 1.2%

◽️Gold price has risen due to both inflation and geopolitics, and the short-term movement for gold is still positive.

◽️Gold uptrend may be limited as the central bank’s determination to raise interest rates

◽️The bearish sentiment leaned towards a pullback next week as investors look to take profits after the last bullish gains

◽️Gold prices have risen due to risks and inflation, but downward pressure is ahead

◽️Technically, after the price past the $1,980 an ounce level, this was a sign of strong interest in the metal

◽️Reducing geopolitical tensions or moderating inflation could also cause gold prices to fall.

🔻 Those who expect lower prices for gold, are confident that they have a good profit and support higher prices going forward.

🔻 One long-term driver remains the global central banks, which are being backed into a corner by high inflation

#weeklygold #XAUUSD

@ziwoxglobal

Weekly gold hints

Weekly gold analysis

◽️Gold is sold in the futures market at the same time as it’s bought by Investment funds.

◽️Hence, gold moves to important support and resistance levels could be significant this week.

◽️Sentiment in the gold market is extremely bullish

◽️10-year bond yields have risen to their highest level in 3 years and it’s possible that we see a new rally in gold

◽️The U.S. central bank expects to start reducing its balance sheet following the May monetary policy meeting and this is a bearish force on gold

◽️Despite all this bearish news, gold has managed to consolidate between $1,900 and $1,950 an ounce and it’s a Bullish sign for Gold

🔻 significant geopolitical uncertainty and if Russia threatens Europe’s oil and gas supply could push equities down and energy prices up 

🔻 If you don’t have any buy position, So don’t try to open a new one in bad risk/reward, BUT if you have a position from last week you have to patience for new higher high 

#weeklygold #XAUUSD

@ziwoxglobal

WEEKLY GOLD HINT and analysis

Weekly gold hint

Weekly gold analysis

◽️Sentiment in the marketplace remains Bullish with Global risk

◽️Gold strongly supported with $1945 and technically gold in range between $1948 and $1960 and tend to move upward

◽️Gold prices withstand with rising bond yields and hawkish speaks of the Federal Reserve and its bullish sign for gold

◽️United states bond yield is in Higher Highs and any correction on US10Y push the gold to high

◽️Gold is a safe-haven asset and uncertainty between Ukraine-Russia peace talks, Testing large new missiles North Korea, New conflict between China and Taiwan
prepare an upward pressure on gold

🔻 Although the federal reserve is looking to raise the interest rates aggressively, inflation still remains in the market and it will be a positive for gold

🔻 Price fixed in the $1960 area will be a good idea to take long on gold

#weeklygold #XAUUSD

GOLD, tend more to long by Alisabbaghi on TradingView.com

How to Use the Gold-to-Silver Ratio?

We have debunked the myth that the gold-to-silver ratio should revert to its “true” level around 16. The predominant range for the ratio in modern times is rather well between 40 and 80. Moreover, the notion that the gold-to-silver ratio should revert to some historical average makes no sense. The relative valuation between these two precious metals depends on market forces, like the health of the world economy and monetary demand for both metals or industrial demand for silver. Such factors change over time. For example, gold has nowadays much higher monetary demand compared to silver than in the past, which largely explains why the average ratio in the 21st century was on average higher than earlier.

What else can we learn from the analysis of the historical gold-to-silver ratio? Well, the chart below shows an interesting pattern. The peaks in the ratio are bullish signals, while the bottoms are bearish. Indeed, the gold-to-silver ratio peaked in 2003 and later in 2008, pretty good moments to invest in both gold and silver. Similarly, the bottom in 2011 was an important selling signal, was it not?

Chart 1: The gold-to-silver ratio (the price of gold divided by the price of silver, red line, right axis), the price of gold (yellow line, left axis, London A.M. Fix), and the price of silver (blue line, right axis, London Fix) from 2002 to May 12, 2016.

Gold to Silver ratio

Well, gold leads the dance and silver usually follows

What determines such a tendency? Well, gold leads the dance and silver usually follows. Therefore, during bull markets in the precious metals, gold starts to rally earlier, while silver lags and only later catches up with gold. It makes sense since silver functions mainly as an industrial metal. This is why at the beginning of a precious metals boom, the gold-to-silver ratio increases. As the gold boom intensifies, silver investors also jump on the wagon (we can say that they recall the monetary function of silver and its close relationship with gold, or that the silver market, due to low and volatile silver prices compared to gold, attracts speculators who want to participate in a bull market). The price of silver catches up with gold, so the gold-to-silver ratio declines.

How to use this ratio?

How then can precious metals investors use the gold-to-silver ratio in investing? It should already be clear that when the ratio moves to extremes, it creates a gold and silver trading opportunity for investors. When the ratio is low, it indicates that silver may be overvalued (which is logically equivalent to gold being undervalued). Therefore, if gold buys less than, let’s say, 40 ounces of silver, it may be time to sell silver and buy gold. Similarly, when the ratio is high, it signals that silver may be undervalued. Thus, if gold buys more than, let’s say, 80 ounces of silver, it may be time to buy silver and sell gold.

Another idea would be to view extremes in the ratio as turning points in the entire precious metals sector – the bigger the extreme, the bigger turnaround it could indicate.

However, there is a crucial caveat. Nobody knows for sure the turning point when investors should switch between precious metals. The ratio may hit 80 (or 40) and continue to expand (dive) for a while, as the fundamentals may change, justifying a new range for the ratio. History does not repeat itself, it only rhymes.

It is important to realize that the decline in the gold-to-silver ratio may correspond with the bull market in both silver and gold – the key to understanding this is the fact that precious metals tend to move in tandem, but gold precedes silver, as mentioned previously. Since the latter accelerates later and acts like “gold on steroids” (silver is more volatile than gold both during upside and downside moves), investing in silver increases potential profits, but also potential losses compared to gold. In other words, the gold-to-silver ratio may signal a trend in both metals. If the ratio is high (let’s say above 80), investors should increase their position in silver relative to gold, but they do not have to actually sell gold. The price of gold in silver ounces is likely to decline, but it does not mean that the U.S. dollar price of gold is also going to drop. Actually, the absolute price of gold should also increase, although at a slower pace than silver prices.

Let’s analyze the chart below to find out what the gold-to-silver ratio tells about the current state of the precious metals market.

Chart 2: The gold-to-silver ratio (the price of gold divided by the price of silver, red line, right axis), the price of gold (yellow line, left axis, London A.M. Fix) and the price of silver (blue line, right axis, London Fix) from 2013 to May 31, 2016

Gold to Silver ratio

As one can see, the gold-to-silver ratio pushed above 80 in January 2016, reaching a level not seen since 2008. This may signal that gold and silver may begin a new bull market (it, however, doesn’t rule out another big drop in prices, before an expected bull market would begin). It goes without saying that the peak in the ratio may also indicate a recession (just like in 2008) or at least an important economic slowdown. When the economy is slowing down, the industrial demand for silver suffers, while the price of gold is supported by safe-haven bids. However, the ratio started to decline in April. The drop from the peak came because of an increase in silver prices in April. Silver underperformed gold in the first quarter of 2016, but it accelerated in April. Indeed, the decline in the ratio indicated that silver was rising faster than gold. However, in May the ratio rebounded, as silver decreased more than gold. Despite the recent decline, the ratio is still at a relatively elevated level.

If you enjoyed the above analysis and would you like to know more about the gold-to-precious metals ratios, we invite you to read the June Market Overview report. If you’re interested in the detailed price analysis and price projections with targets, we invite you to sign up for our Gold & Silver Trading Alerts. If you’re not ready to subscribe at this time, we invite you to sign up for our gold newsletter and stay up-to-date with our latest free articles. It’s free and you can unsubscribe anytime.

source: fxstreet.com

author: Arkadiusz Sieroń

Leave a Reply

Subscribe toour newsletter!

Exclusive offers, news, and promotions delivered to your inbox. Never miss a discount again.
Privacy Settings
We use cookies to enhance your experience while using our website. If you are using our Services via a browser you can restrict, block or remove cookies through your web browser settings. We also use content and scripts from third parties that may use tracking technologies. You can selectively provide your consent below to allow such third-party embeds. For complete information about the cookies we use, data we collect, and how we process them, please check our Privacy Policy
Youtube
Consent to display content from - Youtube
Vimeo
Consent to display content from - Vimeo
Google Maps
Consent to display content from - Google